
12 Action Steps
STEP 7: Develop a Strategy for Collecting and Using QAPI Data
Your team will decide what data to monitor routinely. Areas to consider may include:
- Clinical care areas, e.g., pressure ulcers, falls, infections
- Medications, e.g., those that require close monitoring, antipsychotics, narcotics
- Complaints from residents and families
- Hospitalizations and other service use
- Resident satisfaction
- Caregiver satisfaction
- Care plans, including ensuring implementation and evaluation of measurable interventions
- State survey results and deficiencies
- Results from MDS resident assessments
- Business and administrative processes—for example, financial information, caregiver turnover, caregiver competencies, and staffing patterns, such as permanent caregiver assignment. Data related to caregivers who call out sick or are unable to report to work on short notice, caregiver injuries, and compensation claims may also be useful.
This data will require systematic organization and interpretation in order to achieve meaningful reporting and action. Otherwise, it would only be a collection of unrelated, diverse data and may not be useful.
Compare this to an individual resident’s health—you must connect many pieces of information to reach a diagnosis. You also need to connect many pieces of information to learn your nursing home’s quality baseline, goals, and capabilities.
- Your team should set targets for performance in the areas you are monitoring. A target is a goal, usually stated as a percentage. Your goal may be to reduce restraints to zero; if so, even one instance will be too many. In other cases, you may have both short and longer-term goals. For example, your immediate goal may be reducing unplanned re-hospitalizations by 15 percent, and then subsequently by an additional 10 percent. Think of your facility or organization as an athlete who keeps beating his or her own record.
- Identifying benchmarks for performance is an essential component of using data effectively with QAPI. A benchmark is a standard of comparison. You may wish to look at your performance compared to nursing homes in your state and nationally using Nursing Home Compare (www.medicare.gov/ nhcompare); some states also have state report cards. You may compare your nursing home to other facilities in your corporation, if applicable. But generally, because every facility is unique, the most important benchmarks are often based on your own performance. For example, seeking to improve hand-washing compliance to 90 percent in 3 months based on a finding of 66 percent in the prior quarter. After achieving 90 percent for some period of time, the benchmark can be raised higher as part of ongoing, continuous improvement.
- It may be helpful to monitor what happens when residents leave the nursing home or come back, including discharges to the hospital or home. You may examine discharge rates from your post-acute care area, preventable hospitalizations (i.e., hospitalizations that can be avoided through good clinical care), and what happens after the resident returns from the hospital.
- You’ll want to develop a plan for the data you collect. Determine who reviews certain data, and how often. Collecting information is not helpful unless it is actually used. Be purposeful about who should review certain data, and how often—and about the next steps in interpreting the information.
https://www.cms.gov/medicare/provider-enrollment-and-certification/qapi/downloads/qapiataglance.pdf
Introduction
This change package is intended for nursing homes participating in the National Nursing Home Quality Care Collaborative led by the Centers for Medicare & Medicaid Services (CMS) and the Medicare Quality Improvement Organizations (QIOs), to improve care for the millions of nursing home residents across the country. The Collaborative will strive to instill quality and performance improvement practices, eliminate Healthcare- Acquired Conditions (HACs), and dramatically improve resident satisfaction by focusing on the systems that impact quality such as: staffing, operations, communication, leadership, compliance, clinical models, quality of life indicators and specific, clinical outcomes (targeted focus on inappropriate antipsychotics in persons living with dementia, falls, pressure ulcers, physical restraints, urinary tract infections, and healthcare- acquired infections).
This change package is focused on the successful practices of high performing nursing homes. It was developed from a series of ten site visits to nursing homes across the country, and the themes that emerged regarding how they approached quality and carried out their work. The practices in the change package reflect how the nursing homes leaders and direct care staff at these sites shared and described their efforts. The change package is a menu of strategies, change concepts, and specific actionable items that any nursing home can choose from to begin testing for purposes of improving residents’ quality of life and care. The change package is intended to be complementary to such resources as literature reviews and evidence-based tools and resources.
Acknowledgments
We gratefully acknowledge the contributions of the following organizations that so generously shared their time, effective practices, and their experiences which informed the content of this change package.
- Bethany Health Care Center, Framingham MA
- Foulkeways at Gwynedd, Gwynedd PA
- Franciscan Convalescent Hospital, Merced CA
- Jewish Healthcare Center, Worcester MA
- Landis Homes, Lititz PA
- Mercy Retirement & Care Center, Oakland CA
- NHC Healthcare – Anderson, Anderson SC
- NHC Healthcare – Parklane, Columbia SC
- Pleasant View Home, Albert City IA
- Westview Care Center, Britt IA
5. Strategy: Be a continuous learning organization.
- Make systems thinking the norm.
- Track your progress.
- Test, test, test!
5.a Change Concept: Make systems thinking the norm.
Action Items
- Establish the nursing home as a learning organization whereby staff identifies areas for improvement in themselves and in care processes at the facility.
- Create daily opportunities for learning. For example, conduct rounding with MD or nurses or discuss short vignettes for learning.
- Discuss processes and systems to identify areas for improvement regularly – in meetings as well as everyday interactions.
- Empower residents to get involved by identifying areas of improvement.
- Build redundancies into the practices in order to prevent errors and lapses. For example, create checks and balances.
- Use prompts and reminders to assist staff in completing critical processes and steps and prevent potential adverse events.
- Make visible and talk about how different processes and activities are inter-related and part of systems.
- Identify implications and consequences of changes to show inter-connectedness and relationships, intended and unintended.
5.b Change Concept: Track your progress.
Action Items
- Measure important indicators of care that are relevant and meaningful to the residents you serve. For example, pressure ulcer rates, falls, infections, emergency department and hospital admissions/readmissions, satisfaction.
- Set stretch goals. Choose national, state, and local performance benchmarks to beat.
- Get everyone involved in setting goals including staff, management, and the board.
- Openly and transparently share your performance data with staff, board, residents and families.
- Be a valued partner to payers and other parts of the health care system by demonstrating the high quality of care you provide, opening the doors to your participation in new care delivery and payment models. For example, Accountable Care Organizations, bundled payment programs, readmissions initiatives.
5.c Change Concept: Test, test, test!
Action Items
- Prioritize opportunities for improvement.
- Know when to make real changes to processes and when to make enhancements to current processes.
- Identify and support a change agent for each improvement project – a cheerleader and/or key facilitator of change in your facility. Choose someone who is expected and able to keep momentum despite setbacks and other factors that come up and distract.
- Use a change methodology like PDSA (Plan, Do, Study, Act) to test small incremental changes; track and monitor your progress.
- Take advantage of existing performance improvement templates and tools that are easy to use and guide systems thinking to define the problem, test interventions and measure the impact on the problem and on the larger system. Tools may include flowcharting, the PDSA cycle and root cause analysis.
- Use an action plan template that defines who and when—to establish time lines and accountability.
- Use a multi-department and multi-disciplinary approach to improvement. Involve people who care about the process being improved.
- Involve residents and external stakeholders in improvement initiatives.
- Set specific numerical performance improvement goals that staff and leadership personally own, believe in and understand their role in achieving.
- Track and report progress in meeting performance improvement goals.
- Celebrate success and find creative ways to reward and recognize staff who contribute to achievement of goals.
- Set up a scoreboard for staff that monitors progress towards important goals. Example of a goal: days at zero pressure ulcers. Post the scoreboard that chart progress in common areas such as halls, staff room, etc.
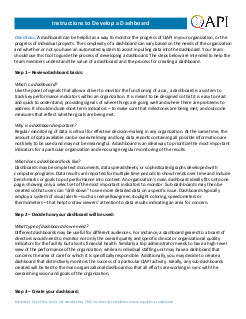
Instructions to Develop a Dashboard
Directions: A dashboard can be helpful as a way to monitor the progress of QAPI in your organization, or the progress of individual projects. The complexity of a dashboard can vary based on the needs of the organization and whether or not you have an automated system to assist in pulling data into the dashboard. Your team should use this tool to guide the process of developing a dashboard. The steps below are intended to help the team members understand the value of a dashboard and the process for creating a dashboard.
Step 1 – Review dashboard basics:
What is a dashboard?
Like the panel of signals that allow a driver to monitor the functioning of a car, a dashboard is a system to track key performance indicators within an organization. It is meant to be designed so that it is easy to read and quick to understand, providing signals of where things are going well and where there are problems to address. It should include short term indicators – to make sure that milestones are being met, and outcome measures that reflect whether goals are being met.
Why is a dashboard important?
Regular monitoring of data is critical for effective decision-making in any organization. At the same time, the amount of data available can be overwhelming and long data reports containing all possible information are not likely to be used and may not be meaningful. A dashboard is an ideal way to prioritize the most important indicators for a particular organization and encourage regular monitoring of the results.
What does a dashboard look like?
Dashboards may be simple text documents, data spreadsheets, or sophisticated graphs developed with computer programs. Data results are reported for multiple time periods to show trends over time and include benchmarks or goals to put performance into context. An organization’s main dashboard ideally fits onto one page, showing only a select set of the most important indicators to monitor. Sub-dashboards may then be created so that users can “drill-down” to see more detailed data on a specific issue. Dashboards typically employ a system of visual alerts—such as red-yellow-green stoplight coloring, speedometers or thermometers—that help to draw viewers’ attention to data results indicating an area for concern.
Step 2 – Decide how your dashboard will be used:
What type of dashboard do we need?
Different dashboards may be useful for different audiences. For instance, a dashboard geared to a board of directors would need to monitor not only the overall quality and specific clinical or organizational quality indicators for the facility but also its financial health. Similarly a top administrator needs to have a high-level view of the performance of the organization, while an individual staffing unit may have a dashboard that concerns the area of care for which it is specifically responsible. Additionally, you may decide to create a dashboard that distinctively monitors the success of a particular QAPI activity. Ideally, any sub-dashboards created will be tied to the main organizational dashboard so that all efforts are working in sync with the overarching vision and goals of the organization.
Step 3 – Create your dashboard:
The following is a list of steps to consider in developing a dashboard. These steps are not necessarily listed in the order in which they must take place, but represent a general path to follow in creating a dashboard panel for your organization.
- Determine what type of dashboard you are creating and its purpose. For example, this may be a main organizational dashboard for the purpose of monitoring the facility’s overall health or a project- centered dashboard to examine the results of specific improvement efforts.
- Assemble the team. Depending on which type of dashboard you are creating, the highest level of leadership taking ultimate responsibility for the indicators will need to be involved. Other key team members include those responsible for producing the results measured, those affected by the results as well as any other users of the dashboard tool. Gathering input from your quality committee will provide the best vantage point to select the most appropriate indicators as well as help to ensure buy- in and support for the process.
- Write an objective for what the dashboard should monitor. For a main organizational dashboard, this will involve reviewing the organization’s mission, vision and strategic plan to elicit the most important goals for the organization to achieve. For a project-level dashboard, the objective will relate to the outcomes the improvement efforts are trying to produce. A dashboard in this case can help to emphasize the different parts of the system that influence whether or not the outcome is achieved.
- Establish the principal measure domains to include. Based on your written objective for what the dashboard should monitor, determine all of the principal measure domains that must be included in order to adequately meet your measurement objectives. Domains could include clinical outcomes, satisfaction, quality of life, safety, finances, staffing or various other domains (see Inventory of Potential Measures and Indicators).
- Determine what indicators are available within each of the measure domains you have selected. Indicators can be drawn from your own internal data sources, from the literature regarding appropriate and expected rates of an activity or situation, from state-sponsored report cards or inspections, national campaigns such as Advancing Excellence in America’s Nursing Homes or federal initiatives such as CMS’ Nursing Home Compare.
- Select indicators. This step will involve reviewing the list of potential indicators available, gathering input from team members and other stakeholders, and looking for sources that will provide either an evidence-base for setting a specific goal level for the indicator or a benchmark goal based on the performance of other facilities.
- Set indicator goals. Upon selecting the indicators to include in your dashboard and reviewing available sources to set goals, establish the preliminary goal level you aim to achieve for each indicator. You may choose to set progressive goals over a particular period of time (e.g., goal of a 10% reduction in the first year followed by a 20% reduction in the following year.)
- Define the specifications for each indicator. Establish how each indicator will be defined and measured by identifying its numerator, denominator, data source, measurement period and any exclusions allowed. This may include a listing of any data codes used in health record management systems.
- Develop a data collection plan. Establish the frequency at which the indicator will be measured and the person(s) responsible for collecting the data and entering it into the dashboard. Different indicators may be collected on different time lines and data time periods should be denoted clearly on the dashboard.
Step 4 – Use your dashboard:
- Determine how the dashboard will be displayed. Determine the type of dashboard you will use to communicate findings (text document, data spreadsheet, etc).
- Establish a dissemination plan. Thinking about who the users are, determine how the dashboard will be shared with others. Will you post the dashboard on a bulletin board? Will only certain staff have password-access to an online dashboard? Will you share dashboard findings with residents and families? What about the general public?
- Develop a plan to review the dashboard and act on the findings. Establish the people responsible for regularly reviewing dashboard findings, at what frequency they will be reviewed and what protocol should be followed to initiate any follow-up action required. Make sure the quality committee and executive leadership is included in those responsible for reviewing and acting on dashboard results.
- Gather baseline data. Test the dashboard by following the data collection plan to populate the indicators with baseline data. This may involve looking back and pulling historical data to show trends to date for the indicators selected.
- Review baseline findings and make adjustments as necessary. Consult with the team to evaluate how the dashboard functions following baseline data input. Make adjustments as necessary or return to earlier steps if it is determined that different indicators are needed.
- Determine a pilot period. Based on the frequency determined for monitoring the dashboard, set a defined period to pilot the new dashboard and establish a date for formal review of the dashboards performance in meeting the originally defined monitoring objective.
Step 5 – Revisit your dashboard:
Remember that a dashboard is a living tool and, therefore, should evolve over time. Establishing regular review periods will help to prevent the dashboard from becoming stagnant and growing obsolete by considering new data sources that have since become available and identifying indicators that are no longer considered useful.
Monitor whether the data collected and shared are acted upon by leadership, the quality committee, and others as appropriate. Remember that simply tracking and trending data will not lead to meaningful change in the lives of residents.
Continue to look for new and innovative indicators to include in your dashboard. The purpose of a dashboard is to challenge your organization not only to meet its goals but to continue to improve and grow in different ways.
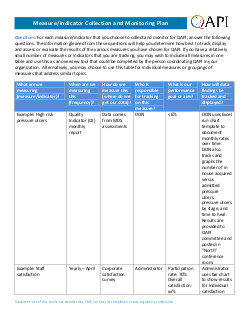
Measure/Indicator Collection and Monitoring Plan
Directions: For each measure/indicator that you choose to collect and monitor for QAPI, answer the following questions. The information gleaned from these questions will help you determine how best to track, display and assess or evaluate the results of the various measures you have chosen for QAPI. If you have a relatively small number of measures or indicators that you are tracking, you may wish to include all measures in one table and use this as an overview tool that could be completed by the person coordinating QAPI in your organization. Alternatively, you may choose to use this table for individual measures or groupings of measures that address similar topics.
| What are we measuring (measure/indicator)? | When are we measuring this (frequency)? | How do we measure this (where do we get our data)? | Who is responsible for tracking on this measure? | What is our performance goal or aim? | How will data findings be tracked and displayed? |
|---|---|---|---|---|---|
| Example: High risk pressure ulcers | Quality Indicator (QI) monthly report | Data comes from MDS assessments | DON | <6% | DON uses Excel run chart template to document monthly rates over time. DON also tracks and graphs the number of in house acquired versus admitted pressure ulcers, pressure ulcers by stage, and time to heal. Results are provided to QAPI committee and posted in “North” conference room. |
| Example: Staff satisfaction | Yearly – April | Corporate satisfaction survey | Administrator | Participation rate: 70% Overall satisfaction: xx% | Administrator uses bar chart to show results for individual satisfaction |
| What are we measuring (measure/indicator)? | When are we measuring this (frequency)? | How do we measure this (where do we get our data)? | Who is responsible for tracking on this measure? | What is our performance goal or aim? | How will data findings be tracked and displayed? |
|---|---|---|---|---|---|
|
Would recommend as place for care: xx%
Would recommend as place to work: xx% |
questions and key composite measures for current and previous 3 years. Results are provided to QAPI committee and posted in “North” conference room. | ||||
| Example: Staff turnover | Monthly and annualized | Human resources department | Human Resources Director | <20% | Human Resources Director uses the Advancing Excellence in America’s Nursing Homes “Monitoring Staff Turnover Calculator.” Results reviewed at QAPI committee. |
| What are we measuring (measure/indicator)? | When are we measuring this (frequency)? | How do we measure this (where do we get our data)? | Who is responsible for tracking on this measure? | What is our performance goal or aim? | How will data findings be tracked and displayed? |
|---|---|---|---|---|---|
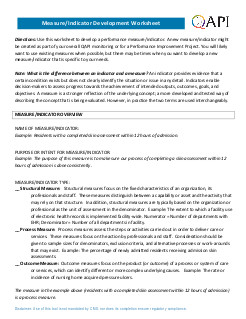
Measure/Indicator Development Worksheet
Directions: Use this worksheet to develop a performance measure/indicator. A new measure/indicator might be created as part of your overall QAPI monitoring or for a Performance Improvement Project. You will likely want to use existing measures when possible, but there may be times when you want to develop a new measure/indicator that is specific to your needs.
Note: What is the difference between an indicator and a measure? An indicator provides evidence that a certain condition exists but does not clearly identify the situation or issue in any detail. Indicators enable decision-makers to assess progress towards the achievement of intended outputs, outcomes, goals, and objectives. A measure is a stronger reflection of the underlying concept; a more developed and tested way of describing the concept that is being evaluated. However, in practice the two terms are used interchangeably.
MEASURE/INDICATOR OVERVIEW
NAME OF MEASURE/INDICATOR:
Example: Residents with a completed skin assessment within 12 hours of admission.
PURPOSE OR INTENT FOR MEASURE/INDICATOR:
Example: The purpose of this measure is to make sure our process of completing a skin assessment within 12 hours of admission is done consistently.
MEASURE/INDICATOR TYPE:
__ Structural Measure: Structural measures focus on the fixed characteristics of an organization, its professionals and staff. These measures distinguish between a capability or asset and the activity that may rely on that structure. In addition, structural measures are typically based on the organization or professional as the unit of assessment in the denominator. Example: The extent to which a facility use of electronic health records is implemented facility-wide. Numerator = Number of departments with EHR; Denominator = Number of all departments in facility.
__ Process Measure: Process measures assess the steps or activities carried out in order to deliver care or services. These measures focus on the action by professionals and staff. Consideration should be given to sample sizes for denominators, exclusion criteria, and alternative processes or work-arounds that may exist. Example: The percentage of newly admitted residents receiving admission skin assessments.
__ Outcome Measure: Outcome measures focus on the product (or outcome) of a process or system of care or services, which can identify different or more complex underlying causes. Example: The rate or incidence of nursing home acquired pressure ulcers.
The measure in the example above (residents with a completed skin assessment within 12 hours of admission) is a process measure.
DEFINING THE MEASURE/INDICATOR SPECIFICATIONS
|
NUMERATOR:
(i.e., when will a person or event be counted as having met the desired result – this is the top number of the fraction you will calculate) |
Example: any resident with a completed skin assessment within 12 hours of admission Numerator: 19 |
|
DENOMINATOR:
(i.e., what is the total pool of persons or events you will be counting – this is the bottom number of the fraction you will calculate) |
Example: all residents admitted in last month. Denominator= 23 |
|
EXCLUSION CRITERIA:
(i.e., is there any reason you would exclude a particular person or event from the denominator count?] |
Example: exclude those residents in the nursing home for less than 24 hours because all assessment data not available Denominator after exclusions: 20 |
|
RESULT CALCULATION:
(i.e., typically expressed as Numerator/Denominator x 100 = rate %) |
Example: 19 / 20 X 100 = 90% |
|
INDICATOR/MEASURE GOAL:
(i.e., the numerical goal aimed for – may be based on an already- established goal for the particular indicator) |
Example: Goal = 100% |
|
INDICATOR/MEASURE THRESHOLD:
(i.e., the minimum acceptable level of performance) |
Example: Threshold = 95% |
MEASURE/INDICATOR DATA COLLECTION
| DATA SOURCE: | Example: Medical records, admission skin assessment form |
|
SAMPLE SIZE AND METHODOLOGY:
(i.e., will you measure the total population under study or draw a sample to represent the whole? If sampling, how large will the sample size be? How will you determine the sample?) |
Example: The total population admitted in the last month who were in the nursing home for at least 24 hours will be reviewed. |
|
FREQUENCY OF MEASUREMENT:
(i.e., how frequently will the indicator result be calculated: daily, weekly, monthly, quarterly, annually?) |
Example: Monthly |
|
DURATION:
(i.e., what is the timeframe for which the data will be collected: number of cases/events in the past weeks, months, quarters? This will depend on how frequently cases/events occur.) |
Example: Will collect this data for three consecutive months; then based on findings, will either develop corrective action and continue monitoring monthly, or consider decreasing frequency of monitoring. |